Biostratigraphic principles
An oil rig has drilled vertically down through unknown rocks for 2000m. At every 50m, spot samples of rock were collected and processed for fossils. Available for you are the ‘fossils’ recovered at each depth. Using the fossil identification chart (and taste!), identify the fossils you have in your sample(s).
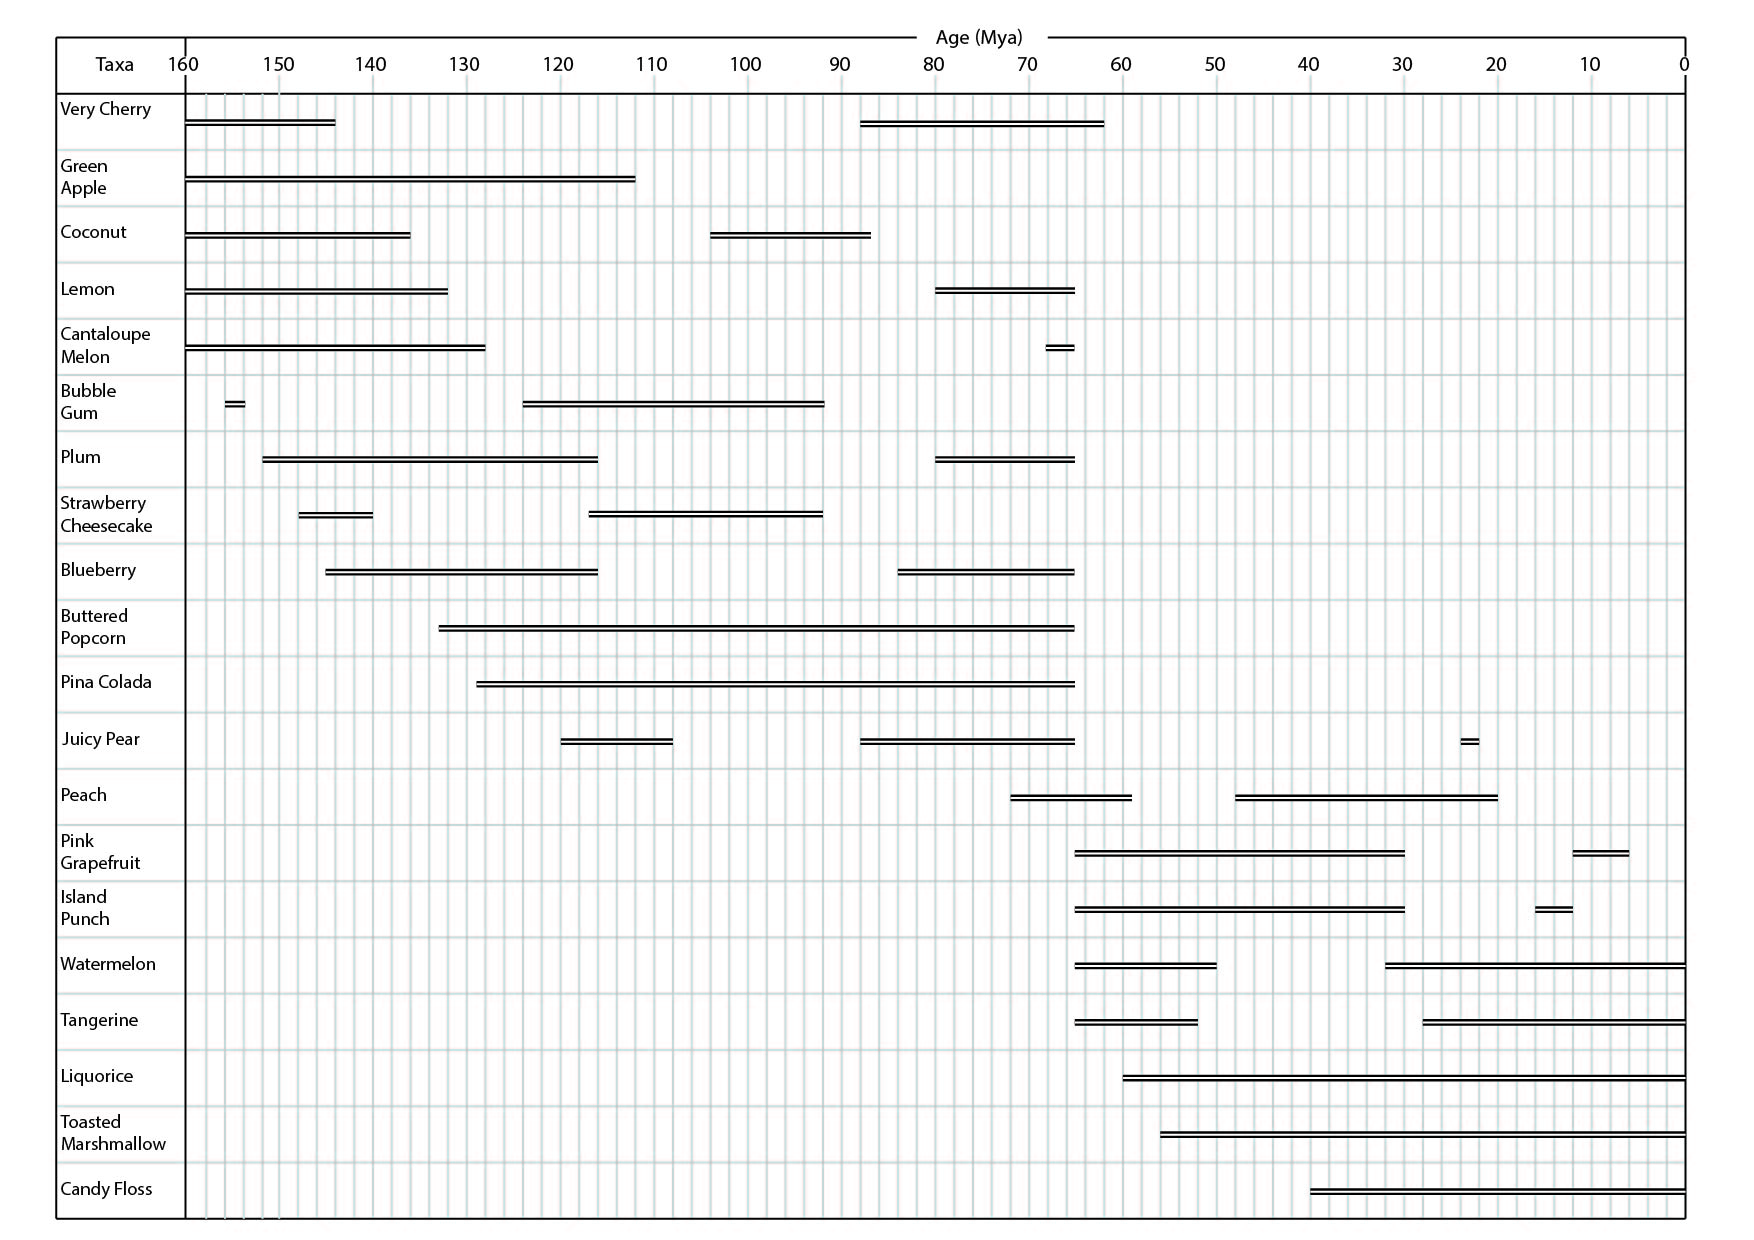
 Now you have an assemblage of fossils, use the distribution chart to provide an age range for your sample. The easiest way to do this is to highlight the age ranges for each of the ‘species’ you have identified and then look for where all your species occur together/overlap. Read the maximum and minimum age range for your assemblage using a ruler. The age range may be very large or quite small.
- How does the age range of your assemblage compare to the age range of any one of your individual species?
Collate the data from all the sample bags.
- What are the smallest and largest time ranges out of all of the assemblages?
- What causes these large and small age ranges?
Plot a graph of depth vs age for all the samples.
- What is the correlation between depth and age?
- Does this make sense?
- Is the such a correlation realistic? Why?
Based on correlations with other wells, the oil company you have been employed by predicts large hydrocarbon reserves to be discovered in rocks deposited around the same time that ‘Green Apple’ went ‘extinct’. At which depth would this have been?
In the distribution chart, there is a large event where many species go extinct and many new lineages evolve.
- When is this?
- Which real event happened at this time?
- Which species survive this event?
Most individual species in this distribution chart have fragmentary age ranges.
- Which species have the absolute largest and smallest ranges?
- Why might some species have gaps in their age ranges? How can they disappear and then reappear?
Where a fossil disappears and then reappears, it is known as a ‘Lazarus taxon’.
- If we have gaps in the age ranges of so many species, what does this tell you about the fossil record as a whole?
The ‘Signor-Lipps effect’ states that it is highly improbable that we could ever find the first and last occurrence of any given species.
- Cantaloupe melon and Watermelon appear closely related. Given the Signor-Lipps effect, would you be confident to say that one evolved from the other?
Further discussion points:
- How might the rarity of a species affect how often it is preserved as a fossil?
- What would the ideal ‘zone fossil’ (one that reflects a very short period of time independently) be?
- How might we increase the accuracy of our results?
Jelly beans are here used as an analogy because they look superficially similar to ostracods. These tiny crustaceans are used often for biostratigraphy. Please follow the link below to listen to an interview about ostracods and their use.
Podcast: Download (Duration: 38:27 — 52.8MB)